Skip to content

Data study · 十羊九不全

Do Goat Years Have Fewer Births? Registry Data Says No

No. In birth registries from Taiwan, Hong Kong and Singapore, Goat years average within a few percent of the years around them, while Dragon years run 7.2–11.8% higher and Tiger years 3.7–8.2% lower.

The Dragon and Tiger patterns match what earlier studies found (Daniel Goodkind, 1996, for Singapore; Paul Yip, Joseph Lee and Y. B. Cheung, 2002, for Hong Kong; Sumit Agarwal, Wenlan Qian, Tien Foo Sing and Poh Lin Tan, 2017, for Singapore's Dragon cohorts), which shows the method can detect a zodiac effect when one exists.

Classical Ba Zi (Four Pillars) texts do not single out the 未 Goat branch as an unlucky birth year. Where the saying comes from.

By Shao Chongkai (邵崇愷) · ·

Shao Chongkai compiled the data and wrote this study. About the author

What the data show

  1. Goat years are ordinary. In the 4 series from Taiwan, Hong Kong and Singapore, the average Goat year runs −2.3% to −0.1% against the average of the two years either side. Of the 12 animals, the Goat ranks between 4th and 7th from the bottom.
  2. The Dragon and Tiger effects are real in the same data. Dragon years average +7.2% to +11.8% and are the highest of the 12 animals in all 4 series. Tiger years average −3.7% to −8.2% and are the lowest in 3 of the 4. In Singapore, births with a non-Chinese father, a group less likely to follow the Chinese zodiac, show no Dragon peak: +1.8%, against +11.8% for births with a Chinese father.
  3. The one Goat year that stands out, mainland China 2015, coincides with the two-child policy. China's 2015 birth rate is −9.6% against the average of 2013, 2014, 2016 and 2017. Two of those comparison years are when the selective (2014) and universal (2016) two-child policies took effect. China's other Goat years are 1991 (−0.3%) and 2003 (−2.5%). Because of 2015, the Goat has the lowest average of the 12 animals in the China series (−4.2%, from 3 Goat years).

Sources: Taiwan Ministry of the Interior, Hong Kong Census and Statistics Department, Singapore Department of Statistics, China National Bureau of Statistics and Japan's Ministry of Health, Labour and Welfare. Full table references are in Sources. Data licensed CC BY 4.0.

The Goat against the other 11 animals

Each bar is one zodiac animal. It shows how far that animal's years sat above or below the average of the two years before and the two years after them, averaged over every such year in the series. A bar near zero means an ordinary year. If families avoided Goat years, the gold Goat bar would sit near the bottom, the way the Tiger does.

The first 5 charts are places where many families follow the Chinese zodiac. The last 2 are comparison groups where few do. Every chart uses the same scale, ±15%.

Taiwan (registered births) Goat −0.2%, 4th lowest of the 12 · Dragon +10.2% · Tiger −8.2%
Taiwan (registered births): average birth change by zodiac animal Horizontal bars, one per zodiac animal, showing each animal's average change against the two years either side. Rat +1.5% (6 years); Ox +1.0% (6 years); Tiger −8.2% (6 years); Rabbit −1.5% (6 years); Dragon +10.2% (5 years); Snake −3.0% (5 years); Horse +0.7% (5 years); Goat −0.2% (5 years); Monkey +0.2% (5 years); Rooster −0.1% (5 years); Dog +0.2% (5 years); Pig +1.2% (5 years). Rat +1.5% Ox +1.0% Tiger −8.2% Rabbit −1.5% Dragon +10.2% Snake −3.0% Horse +0.7% Goat −0.2% Monkey +0.2% Rooster −0.1% Dog +0.2% Pig +1.2% −15% 0 +15%
Numbers behind this chart
Taiwan (registered births): average change by zodiac animal
AnimalAverage vs 2 years either sideYearsRank (1 = lowest)
Rat+1.5%611
Ox+1.0%69
Tiger−8.2%61
Rabbit−1.5%63
Dragon+10.2%512
Snake−3.0%52
Horse+0.7%58
Goat−0.2%54
Monkey+0.2%56
Rooster−0.1%55
Dog+0.2%57
Pig+1.2%510
Hong Kong (all births) Goat −2.3%, 4th lowest of the 12 · Dragon +7.2% · Tiger −3.7%
Hong Kong (all births): average birth change by zodiac animal Horizontal bars, one per zodiac animal, showing each animal's average change against the two years either side. Rat −0.6% (5 years); Ox −1.4% (5 years); Tiger −3.7% (5 years); Rabbit +2.0% (6 years); Dragon +7.2% (5 years); Snake −6.2% (5 years); Horse −3.8% (5 years); Goat −2.3% (5 years); Monkey −0.7% (5 years); Rooster +0.3% (5 years); Dog +1.7% (5 years); Pig +3.1% (5 years). Rat −0.6% Ox −1.4% Tiger −3.7% Rabbit +2.0% Dragon +7.2% Snake −6.2% Horse −3.8% Goat −2.3% Monkey −0.7% Rooster +0.3% Dog +1.7% Pig +3.1% −15% 0 +15%
Numbers behind this chart
Hong Kong (all births): average change by zodiac animal
AnimalAverage vs 2 years either sideYearsRank (1 = lowest)
Rat−0.6%57
Ox−1.4%55
Tiger−3.7%53
Rabbit+2.0%610
Dragon+7.2%512
Snake−6.2%51
Horse−3.8%52
Goat−2.3%54
Monkey−0.7%56
Rooster+0.3%58
Dog+1.7%59
Pig+3.1%511
Hong Kong excluding Mainland mothers Goat −1.9%, 6th lowest of the 12 · Dragon +9.7% · Tiger −7.5%
Hong Kong excluding Mainland mothers: average birth change by zodiac animal Horizontal bars, one per zodiac animal, showing each animal's average change against the two years either side. Rat +0.9% (3 years); Ox −3.0% (3 years); Tiger −7.5% (3 years); Rabbit −2.3% (3 years); Dragon +9.7% (3 years); Snake −3.2% (3 years); Horse −0.8% (3 years); Goat −1.9% (3 years); Monkey +0.7% (3 years); Rooster −2.0% (3 years); Dog −0.1% (3 years); Pig +6.3% (3 years). Rat +0.9% Ox −3.0% Tiger −7.5% Rabbit −2.3% Dragon +9.7% Snake −3.2% Horse −0.8% Goat −1.9% Monkey +0.7% Rooster −2.0% Dog −0.1% Pig +6.3% −15% 0 +15%
Numbers behind this chart
Hong Kong excluding Mainland mothers: average change by zodiac animal
AnimalAverage vs 2 years either sideYearsRank (1 = lowest)
Rat+0.9%310
Ox−3.0%33
Tiger−7.5%31
Rabbit−2.3%34
Dragon+9.7%312
Snake−3.2%32
Horse−0.8%37
Goat−1.9%36
Monkey+0.7%39
Rooster−2.0%35
Dog−0.1%38
Pig+6.3%311
Singapore (Chinese father) Goat −0.1%, 7th lowest of the 12 · Dragon +11.8% · Tiger −7.9%
Singapore (Chinese father): average birth change by zodiac animal Horizontal bars, one per zodiac animal, showing each animal's average change against the two years either side. Rat +3.1% (5 years); Ox +4.4% (5 years); Tiger −7.9% (6 years); Rabbit −2.8% (6 years); Dragon +11.8% (5 years); Snake −4.4% (5 years); Horse +1.0% (5 years); Goat −0.1% (5 years); Monkey −1.8% (5 years); Rooster −1.3% (5 years); Dog −0.1% (5 years); Pig +0.2% (5 years). Rat +3.1% Ox +4.4% Tiger −7.9% Rabbit −2.8% Dragon +11.8% Snake −4.4% Horse +1.0% Goat −0.1% Monkey −1.8% Rooster −1.3% Dog −0.1% Pig +0.2% −15% 0 +15%
Numbers behind this chart
Singapore (Chinese father): average change by zodiac animal
AnimalAverage vs 2 years either sideYearsRank (1 = lowest)
Rat+3.1%510
Ox+4.4%511
Tiger−7.9%61
Rabbit−2.8%63
Dragon+11.8%512
Snake−4.4%52
Horse+1.0%59
Goat−0.1%57
Monkey−1.8%54
Rooster−1.3%55
Dog−0.1%56
Pig+0.2%58
Mainland China (birth rate) Goat −4.2%, the lowest of the 12 · Dragon +4.2% · Tiger −2.9%
Mainland China (birth rate): average birth change by zodiac animal Horizontal bars, one per zodiac animal, showing each animal's average change against the two years either side. Rat −2.3% (4 years); Ox −2.1% (4 years); Tiger −2.9% (4 years); Rabbit +1.0% (4 years); Dragon +4.2% (3 years); Snake −1.3% (3 years); Horse +1.9% (3 years); Goat −4.2% (3 years); Monkey −1.0% (4 years); Rooster +3.9% (4 years); Dog +2.0% (4 years); Pig −0.1% (4 years). Rat −2.3% Ox −2.1% Tiger −2.9% Rabbit +1.0% Dragon +4.2% Snake −1.3% Horse +1.9% Goat −4.2% Monkey −1.0% Rooster +3.9% Dog +2.0% Pig −0.1% −15% 0 +15%
Numbers behind this chart
Mainland China (birth rate): average change by zodiac animal
AnimalAverage vs 2 years either sideYearsRank (1 = lowest)
Rat−2.3%43
Ox−2.1%44
Tiger−2.9%42
Rabbit+1.0%48
Dragon+4.2%312
Snake−1.3%35
Horse+1.9%39
Goat−4.2%31
Monkey−1.0%46
Rooster+3.9%411
Dog+2.0%410
Pig−0.1%47
Singapore (non-Chinese father, control) Goat −0.4%, 7th lowest of the 12 · Dragon +1.8% · Tiger −1.1%
Singapore (non-Chinese father, control): average birth change by zodiac animal Horizontal bars, one per zodiac animal, showing each animal's average change against the two years either side. Rat +2.8% (5 years); Ox +2.5% (5 years); Tiger −1.1% (6 years); Rabbit −2.2% (6 years); Dragon +1.8% (5 years); Snake −0.3% (5 years); Horse +0.9% (5 years); Goat −0.4% (5 years); Monkey −0.5% (5 years); Rooster −1.0% (5 years); Dog −0.7% (5 years); Pig −1.2% (5 years). Rat +2.8% Ox +2.5% Tiger −1.1% Rabbit −2.2% Dragon +1.8% Snake −0.3% Horse +0.9% Goat −0.4% Monkey −0.5% Rooster −1.0% Dog −0.7% Pig −1.2% −15% 0 +15%
Numbers behind this chart
Singapore (non-Chinese father, control): average change by zodiac animal
AnimalAverage vs 2 years either sideYearsRank (1 = lowest)
Rat+2.8%512
Ox+2.5%511
Tiger−1.1%63
Rabbit−2.2%61
Dragon+1.8%510
Snake−0.3%58
Horse+0.9%59
Goat−0.4%57
Monkey−0.5%56
Rooster−1.0%54
Dog−0.7%55
Pig−1.2%52
Japan (control) Goat +2.4%, the highest of the 12 · Dragon +1.1% · Tiger +0.5%
Japan (control): average birth change by zodiac animal Horizontal bars, one per zodiac animal, showing each animal's average change against the two years either side. Rat +0.5% (6 years); Ox +0.5% (6 years); Tiger +0.5% (6 years); Rabbit −0.8% (6 years); Dragon +1.1% (6 years); Snake +0.9% (6 years); Horse −5.1% (6 years); Goat +2.4% (6 years); Monkey +0.5% (6 years); Rooster −2.7% (6 years); Dog +1.0% (6 years); Pig +0.2% (6 years). Rat +0.5% Ox +0.5% Tiger +0.5% Rabbit −0.8% Dragon +1.1% Snake +0.9% Horse −5.1% Goat +2.4% Monkey +0.5% Rooster −2.7% Dog +1.0% Pig +0.2% −15% 0 +15%
Numbers behind this chart
Japan (control): average change by zodiac animal
AnimalAverage vs 2 years either sideYearsRank (1 = lowest)
Rat+0.5%67
Ox+0.5%65
Tiger+0.5%66
Rabbit−0.8%63
Dragon+1.1%611
Snake+0.9%69
Horse−5.1%61
Goat+2.4%612
Monkey+0.5%68
Rooster−2.7%62
Dog+1.0%610
Pig+0.2%64

Births by year, Goat years shaded

One chart per series, each on its own scale, from 1950 or the first year the agency publishes. Gold bands mark Goat years, counted by calendar year because that is how agencies publish. A triangle marks a Goat year that sat further from the two years either side than at least 9 in 10 years of the same series, with its change printed beside it. Under each chart is the table behind it.

Taiwan (registered births)

Taiwan (registered births): births by year, 1958 to 2025 Line chart of births for Taiwan (registered births) from 1958 to 2025, source Ministry of the Interior, Department of Household Registration (Taiwan). Goat years are shaded gold; 1967: −6.9% against the two years either side; 1979: +3.7% against the two years either side; 1991: −0.8% against the two years either side; 2003: −2.4% against the two years either side; 2015: +5.2% against the two years either side. Births per year 100k 200k 300k 400k 500k 1960 1980 2000 2020
Births per year. Source: Ministry of the Interior, Department of Household Registration (Taiwan). Gold bands and dots are Goat years.

Goat years: 1967 (−6.9%), 1979 (+3.7%), 1991 (−0.8%), 2003 (−2.4%), 2015 (+5.2%). Their average is −0.2%, 4th lowest of the 12 animals. The highest animal here is the Dragon (+10.2%); the lowest is the Tiger (−8.2%).

The Ministry of the Interior counts births by registration date, not date of birth, so late registrations can move births between calendar years. The largest Goat-year dip is 1967, and its comparison years include 1966, a Fire Horse year.

Table: Taiwan (registered births), 1958–2025
Taiwan (registered births): births by year with each year's change against the two years either side
YearAnimalBirthsvs average of 2 years either side
1958413,679—
1959423,863—
1960422,319+0.2%
1961422,740−0.5%
1962426,325+0.8%
1963427,212+1.8%
1964419,797−0.1%
1965409,620−0.2%
1966418,327+4.4%
1967Goat376,806−6.9%
1968396,886+0.2%
1969393,455+1.3%
1970396,479+2.9%
1971382,797+0.3%
1972368,067−3.0%
1973369,022−0.9%
1974369,671−3.5%
1975369,349−5.4%
1976425,125+9.9%
1977397,373−2.4%
1978410,783−1.0%
1979Goat424,034+3.7%
1980413,881+0.1%
1981414,069+1.8%
1982405,263+2.4%
1983383,439−0.2%
1984371,008+2.8%
1985346,208+0.5%
1986309,230−9.9%
1987314,024−4.3%
1988342,031+7.4%
1989315,299−4.0%
1990335,618+3.2%
1991Goat321,932−0.8%
1992321,632−1.5%
1993325,613+0.5%
1994322,938−0.8%
1995329,581+1.4%
1996325,545+4.2%
1997326,002+7.7%
1998271,450−12.5%
1999283,661−2.4%
2000305,312+14.9%
2001260,354−2.1%
2002247,530−1.9%
2003Goat227,070−2.4%
2004216,419−2.2%
2005205,854−3.4%
2006204,459−0.9%
2007204,414+2.2%
2008198,733+3.6%
2009191,310−0.2%
2010166,886−18.2%
2011196,627−0.0%
2012229,481+18.7%
2013199,113−6.3%
2014210,383−1.1%
2015Goat213,598+5.2%
2016208,440+4.3%
2017193,844−0.8%
2018181,601−2.5%
2019177,767+2.4%
2020165,249+1.4%
2021153,820−0.4%
2022138,986−5.7%
2023135,571+1.3%
2024134,856—
2025107,812—

Hong Kong (all births)

Hong Kong (all births): births by year, 1961 to 2025 Line chart of births for Hong Kong (all births) from 1961 to 2025, source Census and Statistics Department (Hong Kong). Goat years are shaded gold; 1967: −1.5% against the two years either side; 1979: −1.5% against the two years either side; 1991: −2.0% against the two years either side; 2003: −7.5% against the two years either side; 2015: +1.2% against the two years either side. Births per year 25k 50k 75k 100k 125k 1980 2000 2020
Births per year. Source: Census and Statistics Department (Hong Kong). Gold bands and dots are Goat years.

Goat years: 1967 (−1.5%), 1979 (−1.5%), 1991 (−2.0%), 2003 (−7.5%), 2015 (+1.2%). Their average is −2.3%, 4th lowest of the 12 animals. The highest animal here is the Dragon (+7.2%); the lowest is the Snake (−6.2%).

Hong Kong's Census and Statistics Department publishes births in thousands to one decimal place, so every figure is rounded to the nearest 100. The deepest Goat year, −7.5% in 2003, coincides with the SARS outbreak.

Table: Hong Kong (all births), 1961–2025
Hong Kong (all births): births by year with each year's change against the two years either side
YearAnimalBirthsvs average of 2 years either side
1961110,900—
1962112,500—
1963114,600+6.1%
1964107,600+2.5%
1965101,100+0.5%
196691,800−3.3%
1967Goat88,200−1.5%
196882,700−3.2%
196982,500+0.1%
197079,100−2.7%
197179,800−1.5%
197280,300−1.1%
197382,300+1.8%
197483,600+4.2%
197579,800−1.6%
197678,500−3.2%
197780,000−0.4%
197881,000−0.6%
1979Goat82,000−1.5%
198085,300+1.6%
198186,800+3.1%
198286,100+3.5%
198383,300+2.1%
198477,300−2.5%
198576,100+0.7%
198671,600−4.1%
198770,000−4.3%
198875,400+8.1%
198969,600−1.1%
199067,700−4.7%
1991Goat68,300−2.0%
199270,900+2.0%
199370,500+0.9%
199471,600+4.8%
199568,600+3.7%
199663,300+0.3%
199759,300+0.4%
199853,000−7.0%
199951,300−4.4%
200054,100+7.8%
200148,200−3.9%
200248,200−3.2%
2003Goat47,000−7.5%
200449,800−8.6%
200557,100−2.1%
200665,600+2.3%
200770,900+0.0%
200878,800+2.6%
200982,100−1.6%
201088,600+1.8%
201195,500+19.6%
201291,600+20.7%
201357,100−26.2%
201462,300−7.5%
2015Goat59,900+1.2%
201660,900+4.8%
201756,500−0.6%
201853,700+0.7%
201952,900+11.3%
202043,000−2.3%
202137,000−8.4%
202232,500−13.3%
202333,200−3.3%
202436,700—
202531,100—

Hong Kong excluding Mainland mothers

Hong Kong excluding Mainland mothers: births by year, 1986 to 2025 Line chart of births for Hong Kong excluding Mainland mothers from 1986 to 2025, source Census and Statistics Department (Hong Kong). Goat years are shaded gold; 1991: −2.0% against the two years either side; 2003: −4.4% against the two years either side; 2015: +0.6% against the two years either side. Births per year 20k 40k 60k 80k 1990 2000 2010 2020
Births per year. Source: Census and Statistics Department (Hong Kong). Gold bands and dots are Goat years.

Goat years: 1991 (−2.0%), 2003 (−4.4%), 2015 (+0.6%). Their average is −1.9%, 6th lowest of the 12 animals. The highest animal here is the Dragon (+9.7%); the lowest is the Tiger (−7.5%).

This series subtracts births to Mainland women (C&SD table 115-01012) from all births (115-01011). That removes a population that grew sharply in 2001–2012 and was cut by the 2013 delivery quota for non-local women. It starts in 1986, so it covers 3 Goat years, and it carries the rounding of both source tables.

Table: Hong Kong excluding Mainland mothers, 1986–2025
Hong Kong excluding Mainland mothers: births by year with each year's change against the two years either side
YearAnimalBirthsvs average of 2 years either side
198671,206—
198769,550—
198874,536+9.0%
198967,881−0.3%
199064,859−3.8%
1991Goat63,336−2.0%
199264,062+1.6%
199361,658−1.9%
199462,333+2.1%
199561,575+5.1%
199656,806+1.3%
199753,470+2.1%
199846,891−6.4%
199944,120−5.5%
200045,927+7.4%
200140,390−3.0%
200239,694−0.6%
2003Goat36,872−4.4%
200436,591−4.7%
200537,562−3.8%
200639,468−3.0%
200743,326+3.7%
200845,235+3.0%
200944,847−4.6%
201047,952−4.1%
201151,518+1.6%
201258,401+12.7%
201351,603−6.4%
201456,276+2.2%
2015Goat54,334+0.6%
201655,921+5.3%
201752,166−0.2%
201849,717+0.4%
201949,159+10.1%
202040,824−1.8%
202135,841−6.6%
202231,503−12.1%
202331,949−2.9%
202434,825—
202529,506—

Singapore (Chinese father)

Singapore (Chinese father): births by year, 1960 to 2025 Line chart of births for Singapore (Chinese father) from 1960 to 2025, source Singapore Department of Statistics. Goat years are shaded gold; 1967: −1.0% against the two years either side; 1979: +2.9% against the two years either side; 1991: −1.2% against the two years either side; 2003: −4.8% against the two years either side; 2015: +3.8% against the two years either side. Births per year 10k 20k 30k 40k 50k 1960 1980 2000 2020
Births per year. Source: Singapore Department of Statistics. Gold bands and dots are Goat years.

Goat years: 1967 (−1.0%), 1979 (+2.9%), 1991 (−1.2%), 2003 (−4.8%), 2015 (+3.8%). Their average is −0.1%, 7th lowest of the 12 animals. The highest animal here is the Dragon (+11.8%); the lowest is the Tiger (−7.9%).

Singapore's Department of Statistics counts births by the father's ethnic group. Births with a Chinese father are the closest available stand-in for families that follow the Chinese zodiac. The table covers residents and non-residents together, so it is a stand-in, not a clean count.

Table: Singapore (Chinese father), 1960–2025
Singapore (Chinese father): births by year with each year's change against the two years either side
YearAnimalBirthsvs average of 2 years either side
196044,964—
196143,059—
196241,933−2.0%
196342,214+2.2%
196440,937+1.2%
196539,337−0.0%
196638,366+2.1%
1967Goat35,850−1.0%
196834,248−3.2%
196932,873−6.2%
197034,410−2.1%
197135,608+0.0%
197237,797+7.6%
197337,322+8.8%
197433,126−4.9%
197530,635−8.2%
197633,624+9.0%
197729,402−6.2%
197830,177−2.7%
1979Goat30,925+2.9%
198030,142−1.2%
198130,488+1.7%
198230,502+3.7%
198328,321−4.9%
198428,744+1.3%
198529,352+4.6%
198625,361−19.6%
198729,839−4.7%
198838,245+24.6%
198932,330−5.5%
199035,296+2.7%
1991Goat33,423−1.2%
199233,475−2.3%
199334,251+2.0%
199434,080+1.5%
199533,384−0.2%
199633,230+3.5%
199732,285+4.0%
199828,641−9.4%
199928,973−3.4%
200031,967+14.7%
200127,063−3.4%
200226,782−0.3%
2003Goat24,326−4.8%
200424,060−3.8%
200524,313−1.2%
200624,646−0.5%
200725,390+2.5%
200825,331+3.2%
200924,799+0.5%
201023,303−8.2%
201124,691+0.0%
201226,760+9.4%
201323,890−7.1%
201425,958+3.0%
2015Goat25,412+3.8%
201624,749+1.7%
201723,360−2.8%
201822,650−3.0%
201923,305+3.6%
202022,012+0.0%
202122,002+4.0%
202220,073−3.5%
202319,258−2.4%
202419,926—
202516,902—

Mainland China (birth rate)

Mainland China (birth rate): births per 1,000 people by year, 1978 to 2025 Line chart of births per 1,000 people for Mainland China (birth rate) from 1978 to 2025, source National Bureau of Statistics of China. Goat years are shaded gold; 1991: −0.3% against the two years either side; 2003: −2.5% against the two years either side; 2015: −9.6% against the two years either side. Births per 1,000 people 5 10 15 20 25 1980 2000 2020 2015 −9.6%
Births per 1,000 people. Source: National Bureau of Statistics of China. Gold bands and dots are Goat years; a triangle marks an unusually large Goat-year change.

Goat years: 1991 (−0.3%), 2003 (−2.5%), 2015 (−9.6%). Their average is −4.2%, the lowest of the 12 animals. The highest animal here is the Dragon (+4.2%); the lowest is the Goat (−4.2%).

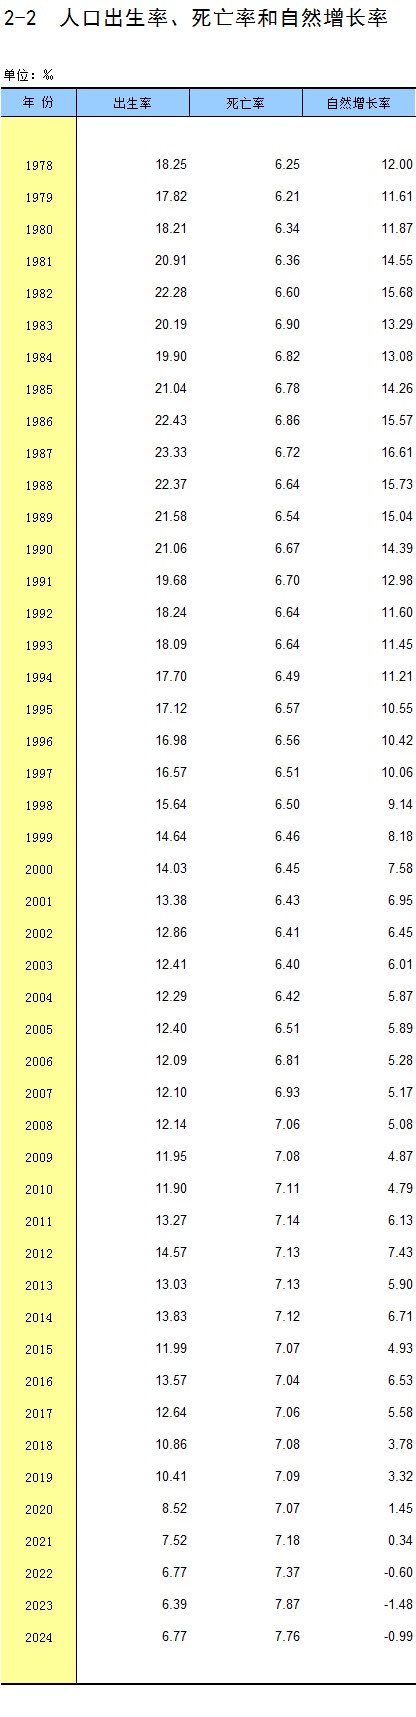
The National Bureau of Statistics publishes a birth rate per 1,000 people, not a count, and this series begins in 1978. 1979 has no comparison because it needs 1977, which is not in the series. In 2015 the rate was 11.99, between 13.83 in 2014 and 13.57 in 2016, the years the two-child policies took effect, so the comparison years themselves are unusual. This is the weakest series on the page: annual rates only, from 1978, and the 2025 Statistical Yearbook revised several earlier years after the 2020 census.

Table: Mainland China (birth rate), 1978–2025
Mainland China (birth rate): births per 1,000 people by year with each year's change against the two years either side
YearAnimalBirths per 1,000 peoplevs average of 2 years either side
197818.25—
1979Goat17.82—
198018.21−8.1%
198120.91+6.5%
198222.28+12.5%
198320.19−4.0%
198419.90−7.4%
198521.04−2.0%
198622.43+3.6%
198723.33+6.7%
198822.37+1.2%
198921.58−0.1%
199021.06+2.9%
1991Goat19.68−0.3%
199218.24−4.7%
199318.09−0.5%
199417.70+0.5%
199517.12−1.2%
199616.98+1.3%
199716.57+3.0%
199815.64+0.5%
199914.64−1.8%
200014.03−0.7%
200113.38−0.8%
200212.86−1.3%
2003Goat12.41−2.5%
200412.29−1.2%
200512.40+1.5%
200612.09−1.2%
200712.10−0.4%
200812.14+1.1%
200911.95−3.3%
201011.90−8.3%
201113.27+3.2%
201214.57+12.0%
201313.03−2.9%
201413.83+4.1%
2015Goat11.99−9.6%
201613.57+10.1%
201712.64+8.0%
201810.86−3.8%
201910.41+5.3%
20208.52−4.2%
20217.52−6.3%
20226.77−7.3%
20236.39−4.2%
20246.77—
20255.63—

Singapore (non-Chinese father, control)

Singapore (non-Chinese father, control): births by year, 1960 to 2025 Line chart of births for Singapore (non-Chinese father, control) from 1960 to 2025, source Singapore Department of Statistics. Goat years are shaded gold; 1967: +2.5% against the two years either side; 1979: −4.0% against the two years either side; 1991: −0.5% against the two years either side; 2003: −3.7% against the two years either side; 2015: +3.4% against the two years either side. Births per year 7.5k 10k 12.5k 15k 17.5k 1960 1980 2000 2020
Births per year. Source: Singapore Department of Statistics. Gold bands and dots are Goat years.

Goat years: 1967 (+2.5%), 1979 (−4.0%), 1991 (−0.5%), 2003 (−3.7%), 2015 (+3.4%). Their average is −0.4%, 7th lowest of the 12 animals. The highest animal here is the Rat (+2.8%); the lowest is the Rabbit (−2.2%).

Births with a non-Chinese father are all births minus the Chinese-father count. This group is less likely to follow the Chinese zodiac, so a zodiac effect should be weaker or missing here, and the Dragon peak is: +1.8%, against +11.8% for births with a Chinese father.

In 2003 this group moved −3.7% while births with a Chinese father moved −4.8%. Both fell together, which fits a shared shock that year (SARS, the economy) better than a pattern specific to one community.

Table: Singapore (non-Chinese father, control), 1960–2025
Singapore (non-Chinese father, control): births by year with each year's change against the two years either side
YearAnimalBirthsvs average of 2 years either side
196016,811—
196116,871—
196217,044−0.1%
196317,316+2.5%
196417,280+3.1%
196516,388−0.1%
196616,314+6.3%
1967Goat14,710+2.5%
196812,993−4.2%
196911,689−7.8%
197011,524−4.1%
197111,480−0.3%
197211,881+7.8%
197310,947+2.3%
197410,142−1.8%
19759,313−5.0%
19769,159−2.8%
19778,962−4.6%
19789,264−5.1%
1979Goat9,854−4.0%
198011,075+2.9%
198111,762+3.8%
198212,152+1.5%
198312,264−1.6%
198412,812+1.3%
198513,132+1.3%
198613,018−4.3%
198713,777−1.9%
198814,712+1.5%
198915,339+2.2%
199015,846+2.8%
1991Goat15,691−0.5%
199215,927+1.1%
199315,974+2.5%
199415,474−1.0%
199515,251−1.4%
199615,347+1.0%
199715,048+0.3%
199815,023+0.5%
199914,363−3.4%
200015,030+4.1%
200114,388+1.8%
200213,978+0.4%
2003Goat13,159−3.7%
200413,114−2.8%
200513,179−2.5%
200613,671−0.4%
200714,100+0.5%
200814,495+1.4%
200914,771+1.5%
201014,664−2.5%
201114,963−2.2%
201215,903+3.0%
201315,830−0.9%
201416,274+0.1%
2015Goat16,773+3.4%
201616,502+0.5%
201716,255−0.9%
201816,389+0.4%
201915,974−3.0%
202016,578+2.7%
202116,670+6.9%
202215,532+1.3%
202314,283−3.1%
202413,777—
202512,962—

Japan (control)

Japan (control): births by year, 1950 to 2025 Line chart of births for Japan (control) from 1950 to 2025, source Ministry of Health, Labour and Welfare (Japan). Goat years are shaded gold; 1955: +0.8% against the two years either side; 1967: +11.5% against the two years either side; 1979: +0.0% against the two years either side; 1991: +0.6% against the two years either side; 2003: −0.1% against the two years either side; 2015: +1.7% against the two years either side. Births per year 500k 1M 1.5M 2M 2.5M 1960 1980 2000 2020 1967 +11.5%
Births per year. Source: Ministry of Health, Labour and Welfare (Japan). Gold bands and dots are Goat years; a triangle marks an unusually large Goat-year change.

Goat years: 1955 (+0.8%), 1967 (+11.5%), 1979 (+0.0%), 1991 (+0.6%), 2003 (−0.1%), 2015 (+1.7%). Their average is +2.4%, the highest of the 12 animals. The highest animal here is the Goat (+2.4%); the lowest is the Horse (−5.1%).

Japan has no Goat-year tradition of this kind, which makes it a comparison group. It has its own superstition about the Fire Horse (丙午): the Ministry of Health, Labour and Welfare counts 1,360,974 births in 1966, against 1,823,697 in 1965 and 1,935,647 in 1967. That year alone puts 1966 at −25.9% and makes the Horse the lowest animal here.

The same trough sits among the comparison years for 1967, so 1967 reads +11.5% and the Goat ends up with Japan's highest average. That is a side effect of the method next to a real zodiac dip, not a Goat-year boom. The registry starts in 1899; this study uses 1950 onward so Japan's comparison starts in the same decade as the other series. Each series covers the Goat years its registry reaches, listed in its table.

Table: Japan (control), 1950–2025
Japan (control): births by year with each year's change against the two years either side
YearAnimalBirthsvs average of 2 years either side
19502,337,507—
19512,137,689—
19522,005,162−1.1%
19531,868,040−2.2%
19541,769,580−2.6%
1955Goat1,730,692+0.8%
19561,665,278−0.9%
19571,566,713−6.1%
19581,653,469+2.3%
19591,626,088+1.4%
19601,606,041−1.0%
19611,589,372−2.3%
19621,618,616−1.5%
19631,659,521−1.6%
19641,716,761+6.3%
19651,823,697+9.3%
19661,360,974−25.9%
1967Goat1,935,647+11.5%
19681,871,839+5.1%
19691,889,815−2.4%
19701,934,239−0.8%
19712,000,973+0.6%
19722,038,682+1.2%
19732,091,983+5.0%
19742,029,989+3.2%
19751,901,440−1.3%
19761,832,617−0.9%
19771,755,100−0.9%
19781,708,643+0.4%
1979Goat1,642,580+0.0%
19801,576,889−1.4%
19811,529,455−2.0%
19821,515,392−0.7%
19831,508,687+1.1%
19841,489,780+2.1%
19851,431,577−0.0%
19861,382,946−0.9%
19871,346,658+0.2%
19881,314,006+1.1%
19891,246,802−2.3%
19901,221,585−2.1%
1991Goat1,223,245+0.6%
19921,208,989−0.7%
19931,188,282−2.2%
19941,238,328+3.4%
19951,187,064−1.6%
19961,206,555+0.1%
19971,191,665−0.2%
19981,203,147+1.0%
19991,177,669−1.0%
20001,190,547+1.2%
20011,170,662+0.8%
20021,153,855+0.4%
2003Goat1,123,610−0.1%
20041,110,721+0.2%
20051,062,530−3.8%
20061,092,674+0.4%
20071,089,818+1.0%
20081,091,156+0.9%
20091,070,036−0.5%
20101,071,305+0.8%
20111,050,807−0.1%
20121,037,232−0.2%
20131,029,817+0.5%
20141,003,609−0.9%
2015Goat1,005,721+1.7%
2016977,242+0.9%
2017946,146+0.5%
2018918,400+1.2%
2019865,239−1.6%
2020840,835−0.1%
2021811,622+1.3%
2022770,759+0.6%
2023727,288−1.0%
2024686,173—
2025671,270—

What the numbers do and don't show

Birth counts are shaped by many things at once. These are the ones that complicate a Goat-year reading, and we state them before any conclusion.

  • Two-child policies, 2014 and 2016. Both fall among the comparison years for mainland China's 2015 Goat year.
  • SARS, 2003. The outbreak fell in a Goat year in Hong Kong, Singapore, Taiwan and mainland China at once, so it cannot be separated from any zodiac effect in 2003.
  • Japan's 1966 Fire Horse year sits among the comparison years for 1967, which makes Japan's 1967 look high and Taiwan's 1967 harder to read.
  • Hong Kong Mainland-mother births, 2001–2012, and the 2013 delivery quota for non-local women change who is counted. The excluding-Mainland-mothers series removes that population.
  • Hong Kong rounding. Counts are published to the nearest 100, which matters for small changes.
  • Taiwan registration basis. Counts are by registration date, not date of birth, so late registrations shift births across years.
  • China is rates only, from 1978. Official earlier national figures were not retrievable from the National Bureau of Statistics, so the 1955 and 1967 Goat years are missing for China.
  • Few years per animal. Each average rests on 3 to 6 years per series, so one shock year can move it by a point or more.
  • Calendar years are not zodiac years. The zodiac year runs roughly February to February, and agencies publish by calendar year, so each calendar year stands in for the zodiac year that starts in it. For Singapore and Taiwan, where monthly counts exist, recounting Goat years from February to January changes their figures only slightly and does not change the result. Those realigned figures are not in the CSV.

Birth counts also reflect many choices families make for reasons other than the zodiac. This study measures counts. It does not measure why anyone had a baby when they did.

The saying, and where it comes from

十羊九不全 (shí yáng jiǔ bù quán) is usually translated "of ten sheep, nine are incomplete" — a folk saying that people born in Goat (Sheep) years face hardship.

Its origin is disputed. Explanations in circulation include sheep being raised for slaughter, a claimed corruption of an older auspicious phrase 十羊九福全, and a late-Qing story tied to Empress Dowager Cixi, who was born in a Goat year. None has solid documentary support, and the saying does not appear in the classical astrological texts, so we present these as folklore, not history.

Classical Ba Zi (Four Pillars) texts do not single out the 未 Goat branch as an unlucky birth year.

In Chinese astrology, the Goat, Sheep and Ram are the same sign: 未 (wèi), the eighth Earthly Branch.

The Goat years in this study and their stem-branch pairs: 1955 乙未, 1967 丁未, 1979 己未, 1991 辛未, 2003 癸未, 2015 乙未. 2027 is 丁未, a Fire Goat year, the same pair as 1967. Each Goat year runs roughly February to February, not January to December.

For the zodiac calendar, the 2027 Goat year begins on Chinese New Year, February 6, 2027. Ba Zi charts switch the year pillar at Li Chun, the start-of-spring solar term, which falls on February 4, 2027 in China (the evening of February 3 in the Americas).

A birth year sets only one of the four pillars in a Ba Zi chart. The day pillar, especially the day stem (Day Master), carries more weight in a reading than the year animal.

Babies born before Li Chun (February 4, 2027 in China; February 3 in the Americas) have a 丙午 Fire Horse year pillar for Ba Zi purposes. Babies born on February 4 or 5 are Goat under Ba Zi but still Horse under the Chinese New Year convention.

The stigma is most often aimed at daughters; it has no basis in classical Ba Zi, and we don't endorse it.

More on the 2027 sign: Year of the Fire Goat 2027.

Methodology

In plain words: for every year, we compare births with the average of the two years before and the two years after. A year 5% above that average scores +5%. We then average those scores over all the Goat years in a series, do the same for each of the other 11 animals, and see where the Goat lands among the 12. If families avoided Goat years, the Goat would sit at or near the bottom, the way the Tiger does in Taiwan and Singapore.

The technical version

  1. For every year y from 1950 with data for y−2, y−1, y+1 and y+2, the change is value(y) ÷ mean(y−2, y−1, y+1, y+2) − 1. Years without all four comparison years get no figure.
  2. Each year takes the zodiac animal of its calendar year: branch index (year − 4) mod 12, where Rat = 0, Tiger = 2, Dragon = 4 and Goat = 7.
  3. For each series, the figure for an animal is the mean change over that animal's years (3 to 6 per animal). Rank 1 is the lowest of the 12.
  4. 5 series are primary (Taiwan, Hong Kong, Hong Kong excluding Mainland mothers, Singapore with a Chinese father, mainland China) and 2 are controls (Singapore with a non-Chinese father, Japan). The CSV also holds other cuts of the same births (Taiwan by date of birth and excluding Kinmen and Lienchiang, Singapore totals and other ethnic groups, Hong Kong births to Mainland women). They are marked duplicate in its role column and left out of every figure on this page.
  5. A Goat year gets a triangle on its chart when its change, ignoring sign, is larger than that of at least 90% of all years in the same series.
  6. Nothing is estimated or interpolated. A missing year stays missing. Two series are derived by subtracting one official figure from another and are labelled that way.
  7. To reproduce any figure, average the deviation_pct column of the year-by-year CSV by jurisdiction and zodiac_animal. That CSV is generated from the births CSV.
  8. The comparison is descriptive. It does not control for income, policy, migration or any other driver of births. For how Jade Zodiac handles calendar and chart calculations elsewhere, see our methodology page.

Sources

A birth year sets only one of the four pillars in a Ba Zi chart.

Calculate your child's chart, free

How to cite

Shao Chongkai, "Do Goat Years Have Fewer Births?", Jade Zodiac, October 9, 2026, https://jadezodiac.com/year-of-the-goat-births

The data and this analysis are licensed CC BY 4.0: reuse them with attribution. Press and data questions: see About.

About the author

Shao Chongkai (邵崇愷) is the founder of Jade Zodiac. He compiled this dataset from the national statistics agencies listed above and wrote the analysis. Corrections: use the contact details on our About page.

Planning a 2027 baby?

Read the 2027 Goat baby guide

Changelog: 2026-10-09 — first published.